 Subscribe

Why Australia’s housing price drop is far steeper than you think
Falling property prices are only part of the picture for Aussie homeowners, with inflation quietly eroding housing wealth and making the road to recovery considerably steeper.

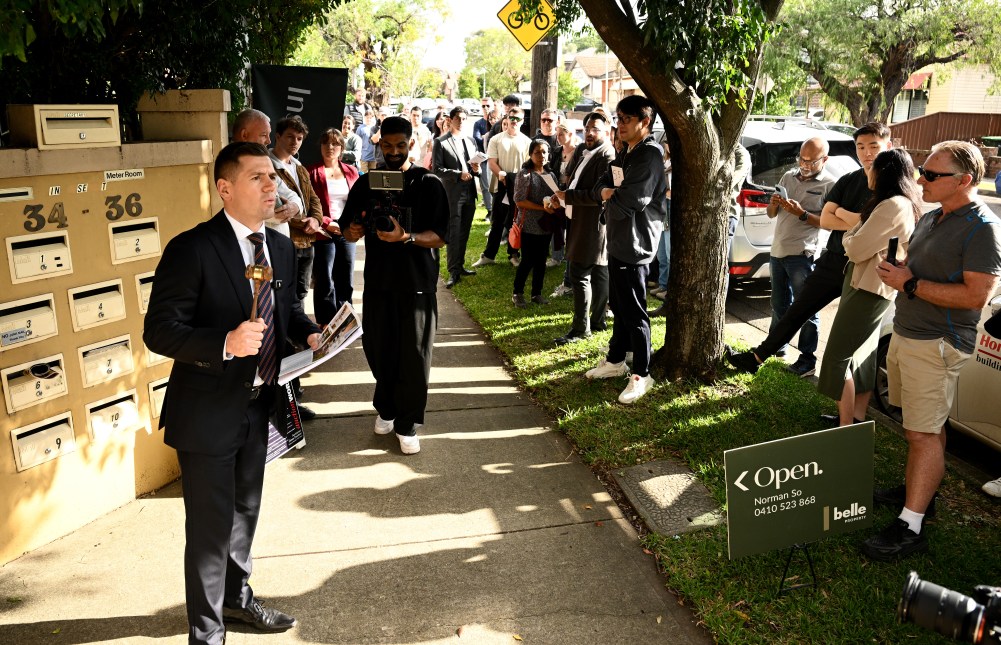
- Cotality found that dwelling values declined in 97 per cent of capital-city suburbs during the September quarter.
- Sydney home values are 8.6 per cent below their February peak, while Melbourne’s nominal decline stretches back to March 2022.
- Melbourne property prices would need to rise more than 30 per cent to recover their previous purchasing power, even if inflation stopped rising.
You don’t need me to tell you that most Australian capital city property markets are losing value.
Indeed, that rather dour news is hard to escape, with Cotality’s latest Home Value Index showing Australian dwelling values fell for a seventh consecutive month in October.
On top of the Federal government’s negative gearing and capital gains tax changes adding to market uncertainty, Aussie housing prices have come under pressure as resurgent inflation nibbles away at consumer purchasing power, while rising interest rates increase borrowing costs.
That’s contributed to a big fall in buyer demand. Cotality reported on Monday that nationwide home sales over the past three months were down 23% from the same period a year ago.
As for dwelling prices (houses and units combined), Tim Lawless, Cotality’s research director, said, “97% of capital city suburbs were down in value over the three months to the end of September, highlighting the broad-based scope of this negative housing cycle.”
Lawless noted that the average value of all dwellings in the five capital cities of Sydney, Melbourne, Brisbane, Adelaide and Perth dropped 4.1% quarter on quarter.
Looking at the September figures, Sydney home prices were down 8.6% from their peak levels, while Melbourne’s prices had declined by 7.5%.
But the real losses are significantly larger than these figures suggest.
(Note: we’re looking at approximate real changes in dwelling prices, based on data from Cotality’s September 2026 Home Value Index and the ABS monthly CPI series, not total investment return after rent, interest, maintenance, or taxes.)
The real cost of inflation
Last week the Australian Bureau of Statistics (ABS) revealed that, rather than easing, Australia’s annual headline inflation increased to 4.3% in September. That’s up from 4.0% in August.
Instead of thinking of inflation solely in terms of rising costs, it can help to think of it as the declining purchasing power of the Aussie dollar.
Your dollar may still be worth a dollar on paper, but inflation reduces what it can buy. At 3% annual inflation, its purchasing power would roughly halve every 24 years, according to the rule of 72.
At 6% annual inflation, then, the purchasing power of that dollar halves around every 12 years.
As you likely recall, Australia’s annual Consumer Price Index (CPI), which measures headline inflation, reached a whopping 7.8% in the December quarter of 2022.
So, let’s see how that affects real price declines from peak levels in Australia’s top housing markets.
As mentioned above, at the end of September, Sydney’s nominal housing prices were down 8.6% from the record levels recorded in February this year.
But after accounting for inflation over this period, the real price decline is closer to 11.2%.
Nominal prices show how much a property is worth in dollar terms, while real prices account for inflation to show how its purchasing power has changed.
We need look no further than Melbourne’s property markets to see how quickly inflation’s eroding power can add to those real losses.
That’s because Melbourne’s record home values were set in March 2022.
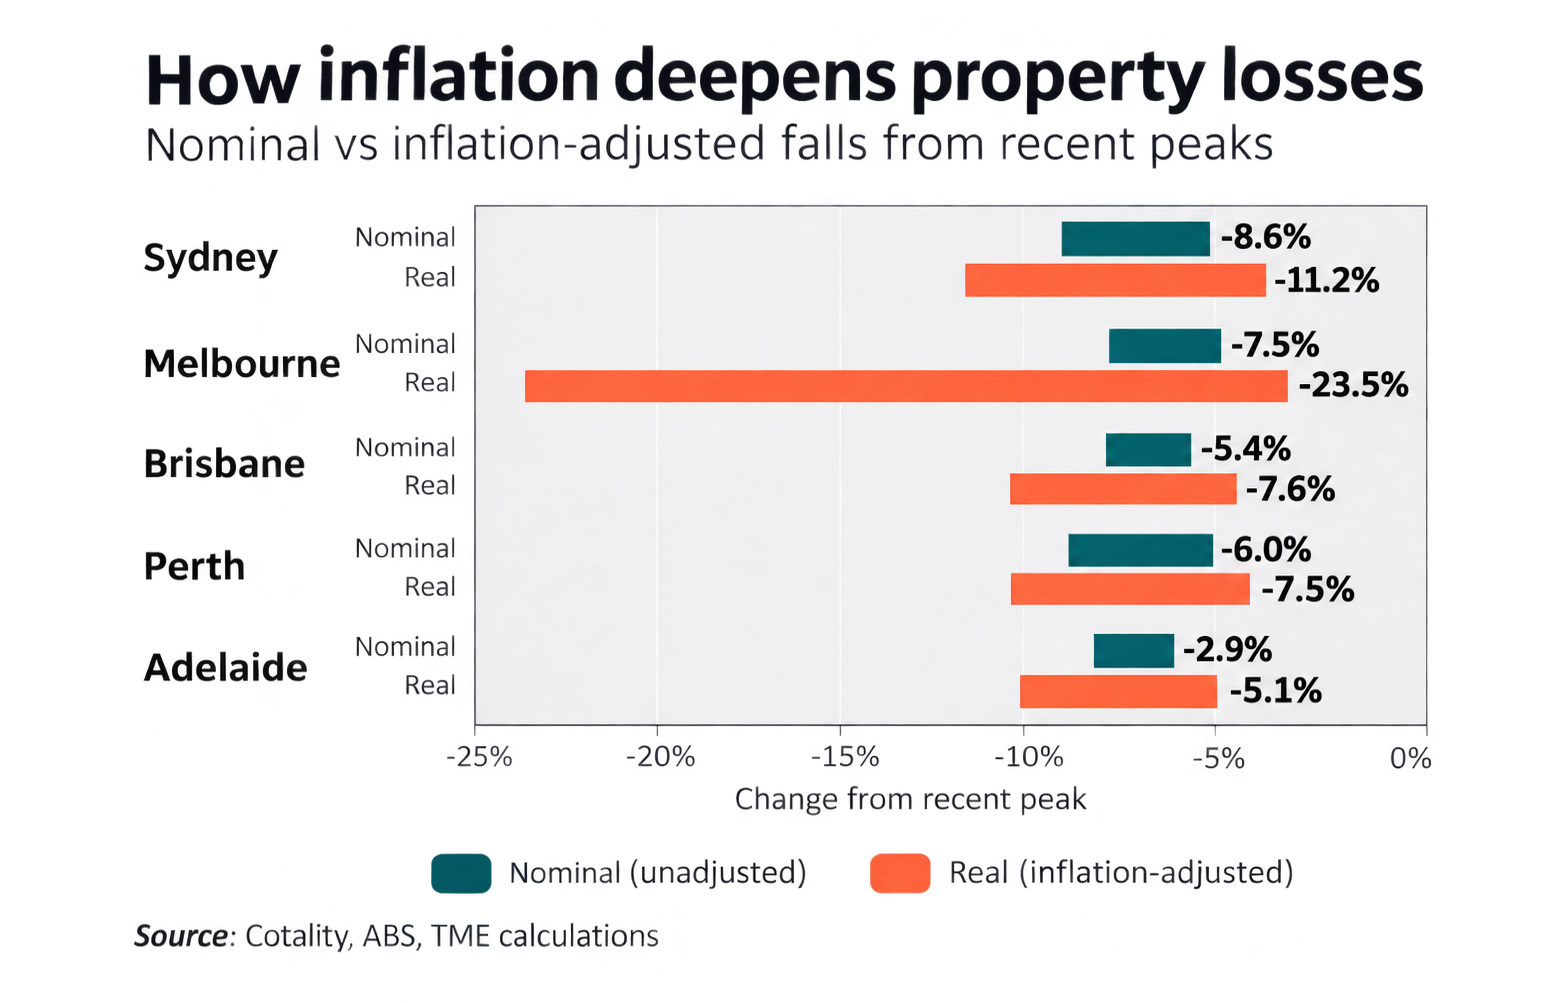
Nominal prices are down 7.5% from that peak, which is less than the nominal falls witnessed in Sydney. But more than four years of inflationary pressures have seen real average prices fall approximately 23.5%.
Now it takes larger gains to offset losses. For example, if an asset loses 50% in value, it will then need to gain 100% to break even.
This means Melbourne’s average home prices will need to gain some 30.7% to recoup the original purchasing power of that investment made at peak levels, assuming no further inflation.
This is a much bigger real price decline than you generally see reported.
As for the other three capital cities mentioned up top, Perth home prices reached a record high in April this year. Nominal prices have fallen 6.0% from the peak, with real prices down an estimated 7.5%.
Brisbane home values hit an all-time high in May this year, then fell 5.4%. Real home prices are down around 7.6% over this period.
Adelaide also posted record dwelling values in May. While nominal values have fallen 2.9% since May, real home prices are down approximately 5.1%.
Both nominal and real capital city home prices are broadly forecast to remain under pressure over the coming months. But once inflation and interest rates begin to come down sustainably, I suspect there will be bargains on offer.
And I believe we’ll then again see Aussie dwelling values marching higher, both in nominal and real terms.
The information provided on this website is general in nature only and does not constitute personal financial advice. The information has been prepared without taking into account your personal objectives, financial situation or needs. Before acting on any information on this website, you should consider the appropriateness of the information having regard to your objectives, financial situation and needs.